Our Interpretation
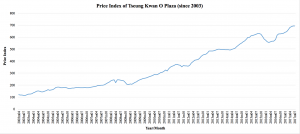
An increasing trend is discovered in both price indices of Tseung Kwan O Plaza and RVD from April 2003 to July 2017. The price index of Tseung Kwan O Plaza raised from 124.9 to 693.2 in 14 years. Due to the economic depression in 2003 and 2008 because of the SARS outburst and Global Financial Crisis, the price index fluctuated but restored quickly with policies to rescue the unemployment rate and restrictions to the short-selling phenomena in Hong Kong. Inflation, the increase in interest rate and growth of housing price in Hong Kong contribute to the increase of price indices of Tseung Kwan O Plaza.
Price Data
| 2003m04 | 119.2 |
| 2003m05 | 117.5 |
| 2003m06 | 116.5 |
| 2003m07 | 114.9 |
| 2003m08 | 115.3 |
| 2003m09 | 119.3 |
| 2003m10 | 123.8 |
| 2003m11 | 125.7 |
| 2003m12 | 127.6 |
| 2004m01 | 135.2 |
| 2004m02 | 141.6 |
| 2004m03 | 150 |
| 2004m04 | 152.6 |
| 2004m05 | 149.2 |
| 2004m06 | 143.6 |
| 2004m07 | 144 |
| 2004m08 | 149.5 |
| 2004m09 | 155.2 |
| 2004m10 | 160.8 |
| 2004m11 | 157.5 |
| 2004m12 | 159 |
| 2005m01 | 163.1 |
| 2005m02 | 171 |
| 2005m03 | 181.6 |
| 2005m04 | 183 |
| 2005m05 | 182.2 |
| 2005m06 | 177.7 |
| 2005m07 | 177.1 |
| 2005m08 | 180.2 |
| 2005m09 | 180 |
| 2005m10 | 176.3 |
| 2005m11 | 170 |
| 2005m12 | 173.2 |
| 2006m01 | 174.8 |
| 2006m02 | 175.2 |
| 2006m03 | 178.4 |
| 2006m04 | 179.5 |
| 2006m05 | 180.7 |
| 2006m06 | 177.4 |
| 2006m07 | 176.9 |
| 2006m08 | 178.8 |
| 2006m09 | 179.4 |
| 2006m10 | 178.8 |
| 2006m11 | 178.5 |
| 2006m12 | 180 |
| 2007m01 | 182.8 |
| 2007m02 | 185.6 |
| 2007m03 | 188.7 |
| 2007m04 | 189.9 |
| 2007m05 | 195.5 |
| 2007m06 | 196.6 |
| 2007m07 | 197.8 |
| 2007m08 | 198.9 |
| 2007m09 | 202.4 |
| 2007m10 | 208.5 |
| 2007m11 | 217.7 |
| 2007m12 | 226 |
| 2008m01 | 237.1 |
| 2008m02 | 242.1 |
| 2008m03 | 243.8 |
| 2008m04 | 221.3 |
| 2008m05 | 244.1 |
| 2008m06 | 244.6 |
| 2008m07 | 241.7 |
| 2008m08 | 238.1 |
| 2008m09 | 236.7 |
| 2008m10 | 223.3 |
| 2008m11 | 205.8 |
| 2008m12 | 204 |
| 2009m01 | 210.1 |
| 2009m02 | 206.8 |
| 2009m03 | 214.3 |
| 2009m04 | 222.7 |
| 2009m05 | 228.7 |
| 2009m06 | 237.2 |
| 2009m07 | 243.1 |
| 2009m08 | 248.7 |
| 2009m09 | 253.5 |
| 2009m10 | 257.3 |
| 2009m11 | 258.5 |
| 2009m12 | 263.6 |
| 2010m01 | 270.9 |
| 2010m02 | 276 |
| 2010m03 | 280.8 |
| 2010m04 | 287.5 |
| 2010m05 | 286.4 |
| 2010m06 | 288.8 |
| 2010m07 | 297.8 |
| 2010m08 | 305 |
| 2010m09 | 307 |
| 2010m10 | 316.1 |
| 2010m11 | 326.6 |
| 2010m12 | 317 |
| 2011m01 | 335.6 |
| 2011m02 | 349.7 |
| 2011m03 | 356.1 |
| 2011m04 | 363.8 |
| 2011m05 | 371.1 |
| 2011m06 | 373 |
| 2011m07 | 367.3 |
| 2011m08 | 366.2 |
| 2011m09 | 350.8 |
| 2011m10 | 363.6 |
| 2011m11 | 361.3 |
| 2011m12 | 359.4 |
| 2012m01 | 357.5 |
| 2012m02 | 366.2 |
| 2012m03 | 384 |
| 2012m04 | 397 |
| 2012m05 | 406.4 |
| 2012m06 | 410 |
| 2012m07 | 412.4 |
| 2012m08 | 422.7 |
| 2012m09 | 438.1 |
| 2012m10 | 450.6 |
| 2012m11 | 455 |
| 2012m12 | 458.8 |
| 2013m01 | 469.4 |
| 2013m02 | 485.1 |
| 2013m03 | 485.1 |
| 2013m04 | 484 |
| 2013m05 | 486.8 |
| 2013m06 | 493.1 |
| 2013m07 | 496.6 |
| 2013m08 | 498.9 |
| 2013m09 | 496.8 |
| 2013m10 | 496.9 |
| 2013m11 | 496.2 |
| 2013m12 | 495.9 |
| 2014m01 | 495 |
| 2014m02 | 494.2 |
| 2014m03 | 493.3 |
| 2014m04 | 496.2 |
| 2014m05 | 501.7 |
| 2014m06 | 507.8 |
| 2014m07 | 521.4 |
| 2014m08 | 531.4 |
| 2014m09 | 542.4 |
| 2014m10 | 551.3 |
| 2014m11 | 559.5 |
| 2014m12 | 568.6 |
| 2015m01 | 582.4 |
| 2015m02 | 596.8 |
| 2015m03 | 596.8 |
| 2015m04 | 609.9 |
| 2015m05 | 613.1 |
| 2015m06 | 618.5 |
| 2015m07 | 625.1 |
| 2015m08 | 628.2 |
| 2015m09 | 629.7 |
| 2015m10 | 622.8 |
| 2015m11 | 605.2 |
| 2015m12 | 585.8 |
| 2016m01 | 573.9 |
| 2016m02 | 561.3 |
| 2016m03 | 556.5 |
| 2016m04 | 560.7 |
| 2016m05 | 565.8 |
| 2016m06 | 566.6 |
| 2016m07 | 578.6 |
| 2016m08 | 616.8 |
| 2016m09 | 626.2 |
| 2016m10 | 626 |
| 2016m11 | 630.2 |
| 2016m12 | 632.2 |
| 2017m01 | 640.1 |
| 2017m02 | 645.8 |
| 2017m03 | 661 |
| 2017m04 | 680.1 |
| 2017m05 | 688.1 |
| 2017m06 | 693 |
| 2017m07 | 693.2 |