
The table below shows the price indices generated based on the transaction records of Castello, showing a change in property price since December, 1999. Average price indices are taken as reference on Classes and Selected Popular Developments (SPD).
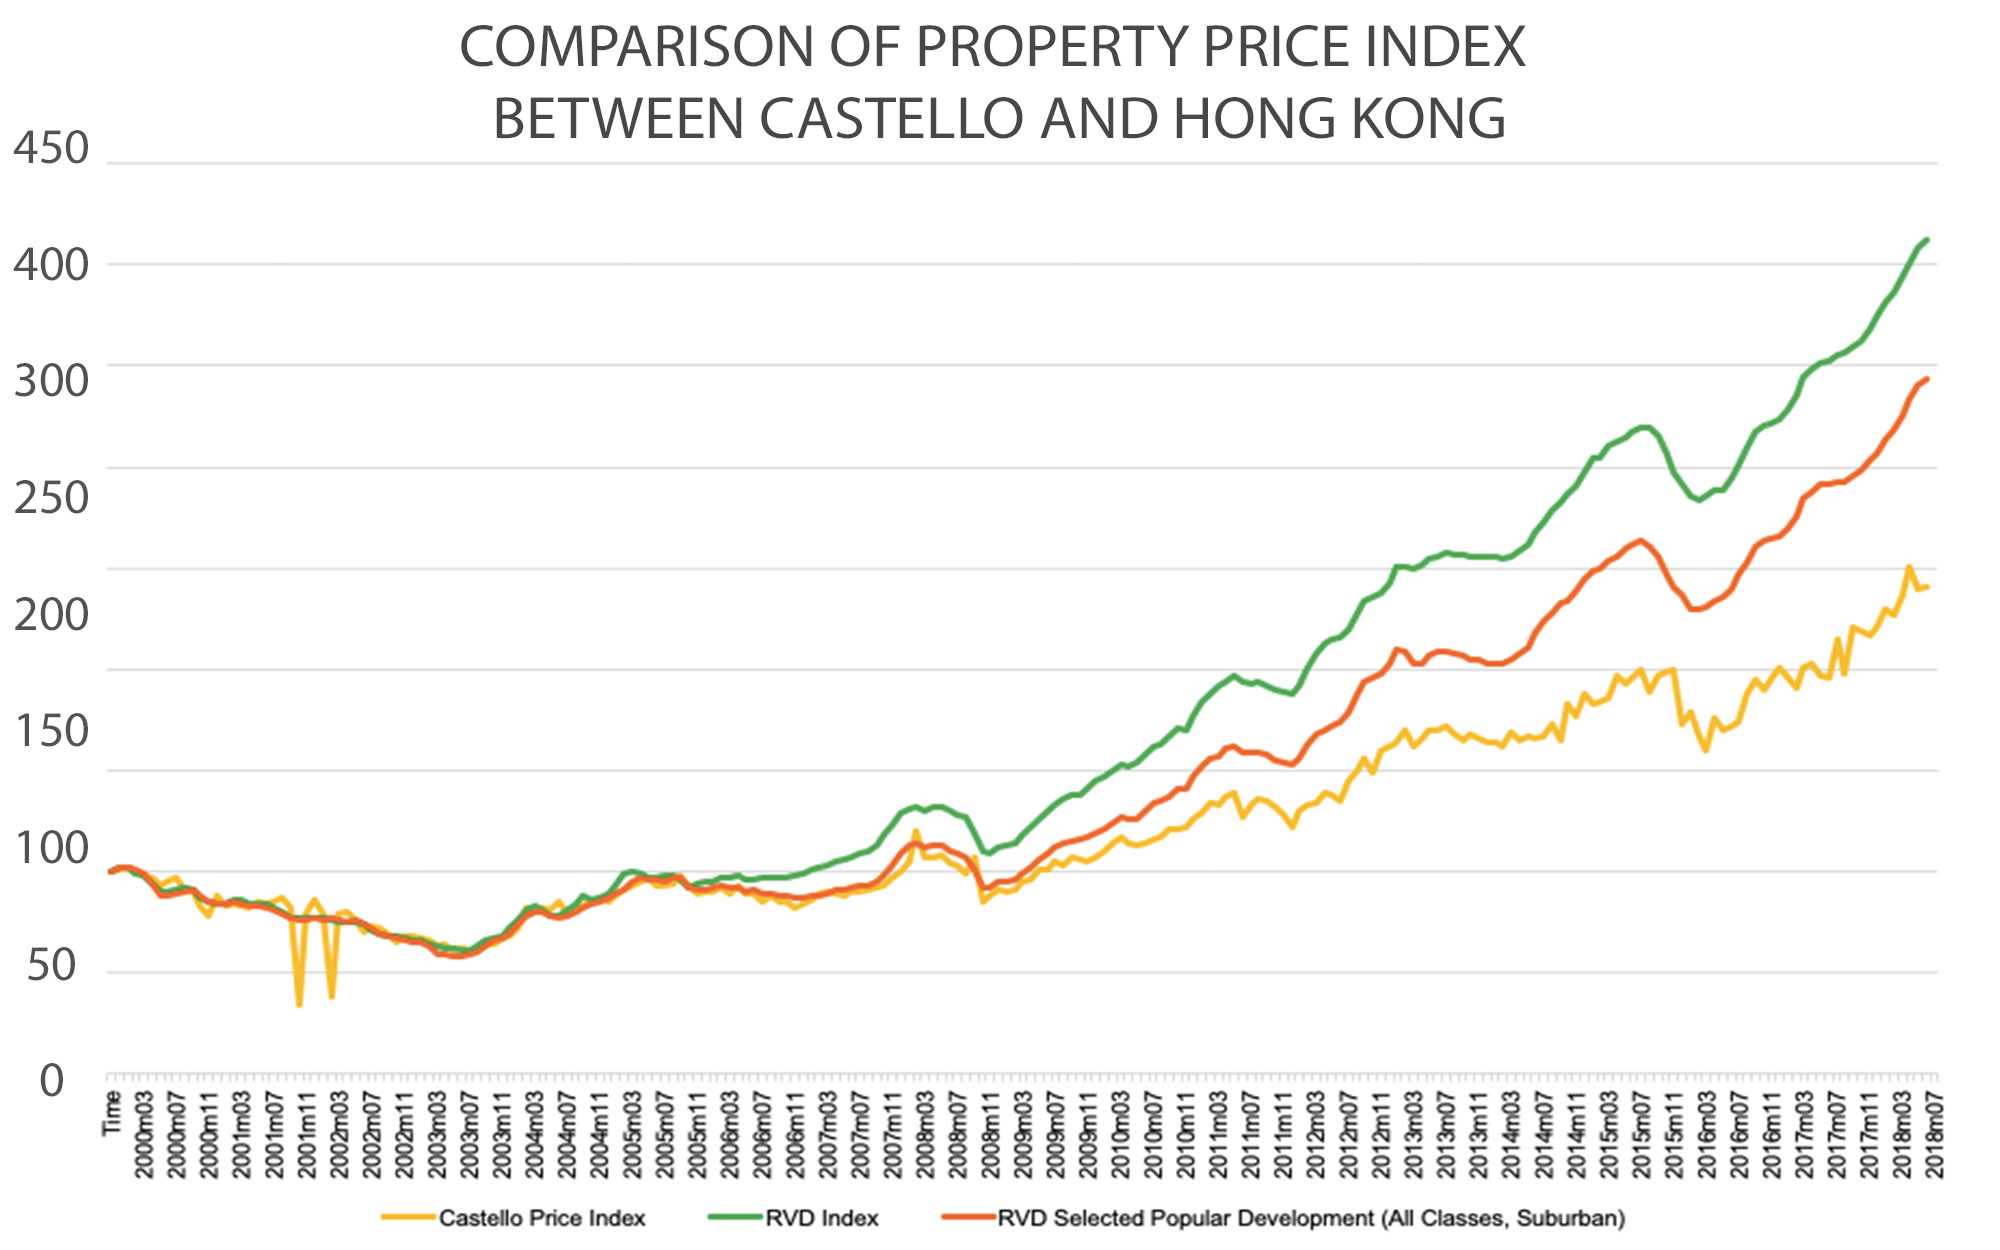
Property Price Trend of Castello
- Decline from 1999-2003
During the period from 1999 to 2003, the housing market shows a steady downward trend. There are three major reasons accounting for that.
- In 1997, Asian financial crisis occured, which led to the downturn of Hong Kong’s economy and reduction of investors’ confidence, in turn adversely affects the demand of housing market.
- In 1997, the new housing policy implemented by the Housing Bureau in 1997. The then Chief Executive Tung Chee Hwa announced a new scheme which aimed to provide at least 85,000 housing units per year (Housing Bureau, 1997) to increase the housing supply in Hong Kong. However, it brought down housing prices due to sudden abundance of supply.
- In 2003 SARS outbreak, the economy plumetted which led to housing price drop significantly. Many housing buyers faced the problem of negative equity the value of their property is less than the outstanding balance on the mortgage.
- Peak and Sudden Drop in 2008
After SARS in 2003, Hong Kong property market began to regain confidence through the formulation of government policies, such as expansion of Mortgage Insurance Programme and removal of security of tenure provisions for domestic tenancies, which helped increase property investment. The Individual Visit Scheme also launched in July 2003, which brought Mainland Investors to invest in Hong Kong housing market. The property price in Castello reached a peak in mid 2008.
However, a financial tsunami strikes Hong Kong in late 2008, which caused a sharp drop of property price. This explains the sudden drop of housing price index of Castello in late 2008.
- Drop from mid-2015 to early 2016
The property price of Castello has been rising steadily for the past 10 years. However, there is a drop in 2015-2016 due to the imposition of 15% flat rate of Special Stamp Duty Rate. Such cooling measure causes the booming of housing market to slow down. Furthermore, the Chinese government launched, at the time, an anti-corruption campaign in the Mainland. This has reduced the amount of capital entering the Hong Kong market, and complement with the effect of the depreciation of Renmenbi, less investors from the Mainland invest in the housing market in Hong Kong.
The price indices from RVD are modified by using 1999m12 as the base level of 100.
Time Index RVD Index RVD SPD* 1999m12 100.00 100.00 100.00 2000m01 101.41 101.88 101.80 2000m02 102.40 101.88 102.12 2000m03 101.25 99.58 101.59 2000m04 97.65 98.12 98.94 2000m05 97.07 94.36 94.07 2000m06 93.34 89.86 87.82 2000m07 95.30 90.49 88.56 2000m08 96.86 91.12 89.51 2000m09 90.97 92.16 90.57 2000m10 90.53 90.91 91.31 2000m11 82.88 87.46 88.14 2000m12 78.18 85.48 84.85 2001m01 88.28 84.33 84.11 2001m02 82.72 83.80 83.79 2001m03 84.32 85.79 85.38 2001m04 83.10 85.89 84.53 2001m05 81.91 84.12 83.47 2001m06 85.30 84.54 83.05 2001m07 83.89 83.80 81.99 2001m08 85.33 82.03 81.46 2001m09 86.78 80.67 78.71 2001m10 81.77 77.43 76.80 2001m11 34.43 76.91 75.85 2001m12 79.03 77.12 76.38 2002m01 86.06 77.43 76.80 2002m02 79.30 77.22 76.69 2002m03 38.81 76.59 77.12 2002m04 78.82 75.55 76.17 2002m05 80.44 75.65 75.53 2002m06 75.94 75.13 75.74 2002m07 70.43 74.09 74.68 2002m08 72.83 71.37 72.56 2002m09 72.44 69.70 69.70 2002m10 69.71 68.34 68.33 2002m11 64.77 68.03 67.16 2002m12 67.74 67.71 66.63 2003m01 68.26 66.46 65.57 2003m02 66.91 66.25 64.83 2003m03 66.60 63.95 63.03 2003m04 63.21 63.22 59.64 2003m05 64.38 62.38 59.11 2003m06 61.28 61.96 58.26 2003m07 62.46 61.02 57.84 2003m08 61.74 61.23 58.79 2003m09 61.55 63.64 60.59 2003m10 65.49 66.25 63.35 2003m11 64.43 67.19 66.42 2003m12 67.35 68.34 67.27 2004m01 68.08 72.62 69.70 2004m02 72.14 76.49 73.73 2004m03 82.02 81.61 78.18 2004m04 81.74 82.97 80.61 2004m05 82.04 80.98 80.30 2004m06 80.80 78.06 78.18 2004m07 85.17 78.27 77.65 2004m08 79.51 81.09 78.60 2004m09 82.45 84.54 79.98 2004m10 83.53 87.88 82.52 2004m11 85.23 86.42 83.79 2004m12 87.08 87.04 84.96 2005m01 85.28 89.55 87.08 2005m02 87.83 93.42 89.19 2005m03 91.46 98.85 91.63 2005m04 93.00 99.69 95.23 2005m05 95.17 99.58 96.82 2005m06 96.69 97.07 95.87 2005m07 93.30 96.97 95.97 2005m08 92.71 98.12 95.23 2005m09 94.12 98.22 96.72 2005m10 97.82 95.92 96.72 2005m11 93.44 92.48 92.06 2005m12 89.56 94.15 90.68 2006m01 90.16 94.88 90.68 2006m02 90.37 95.19 92.06 2006m03 92.34 96.76 92.69 2006m04 89.63 97.60 92.16 2006m05 93.02 98.22 92.06 2006m06 89.53 96.45 90.04 2006m07 89.13 96.03 90.78 2006m08 85.51 97.18 89.19 2006m09 88.16 97.49 89.30 2006m10 85.22 97.28 87.92 2006m11 84.83 97.18 87.71 2006m12 82.38 98.01 86.97 2007m01 84.44 99.48 87.08 2007m02 86.17 100.94 87.82 2007m03 88.74 102.30 88.56 2007m04 90.58 103.13 89.62 2007m05 88.99 105.02 90.89 2007m06 88.61 106.17 90.89 2007m07 89.82 107.42 92.06 2007m08 89.85 108.67 92.80 2007m09 91.49 110.03 93.22 2007m10 92.62 113.38 95.23 2007m11 93.26 118.39 98.52 2007m12 97.11 123.20 103.60 2008m01 100.40 128.74 109.11 2008m02 105.27 131.14 113.03 2008m03 119.97 132.08 113.98 2008m04 107.43 130.30 112.39 2008m05 106.99 132.08 112.92 2008m06 107.90 132.29 112.82 2008m07 103.70 130.51 110.59 2008m08 103.60 128.42 109.32 2008m09 99.07 127.38 107.20 2008m10 106.90 119.44 100.95 2008m11 85.59 109.61 92.37 2008m12 88.64 109.51 92.58 2009m01 90.92 111.91 94.70 2009m02 90.16 112.64 95.13 2009m03 91.22 114.11 96.29 2009m04 94.90 118.50 99.26 2009m05 96.01 121.94 102.33 2009m06 101.04 126.54 106.57 2009m07 100.67 129.68 109.53 2009m08 105.08 133.12 112.39 2009m09 103.11 135.74 114.51 2009m10 107.27 137.62 115.47 2009m11 106.41 138.24 116.00 2009m12 105.55 140.75 116.63 2010m01 107.15 144.51 118.96 2010m02 110.17 147.02 121.29 2010m03 113.70 149.84 123.62 2010m04 116.80 153.19 126.69 2010m05 113.92 152.35 125.85 2010m06 112.60 153.50 126.38 2010m07 114.41 158.10 130.08 2010m08 116.35 161.86 133.69 2010m09 116.93 163.11 134.75 2010m10 121.57 167.40 137.50 2010m11 121.48 171.06 141.00 2010m12 122.51 170.32 140.68 2011m01 126.07 177.12 146.61 2011m02 129.52 184.33 152.22 2011m03 134.16 187.57 155.93 2011m04 133.49 191.54 157.42 2011m05 137.02 194.25 160.49 2011m06 139.23 196.55 161.76 2011m07 126.85 193.83 158.79 2011m08 132.84 192.79 159.32 2011m09 136.15 193.94 159.32 2011m10 134.99 191.43 157.52 2011m11 131.70 190.18 155.40 2011m12 128.23 189.24 153.60 2012m01 122.27 187.88 153.07 2012m02 129.73 192.06 156.46 2012m03 133.39 200.84 163.14 2012m04 133.96 207.42 167.58 2012m05 138.59 212.33 170.34 2012m06 137.82 214.32 172.25 2012m07 134.86 215.36 173.73 2012m08 145.23 220.27 178.81 2012m09 150.04 227.59 187.82 2012m10 156.40 233.75 193.43 2012m11 148.58 236.05 195.76 2012m12 160.09 237.83 198.20 2013m01 161.98 242.95 203.28 2013m02 163.89 250.78 209.75 2013m03 170.43 250.68 209.11 2013m04 162.26 250.16 202.54 2013m05 165.81 251.62 203.18 2013m06 170.10 254.23 206.89 2013m07 169.86 256.11 208.79 2013m08 172.32 257.37 208.37 2013m09 168.37 256.53 207.84 2013m10 165.25 256.43 206.36 2013m11 167.53 256.01 204.87 2013m12 165.83 256.11 205.08 2014m01 164.14 255.69 203.07 2014m02 164.12 255.28 203.07 2014m03 162.37 254.65 203.07 2014m04 168.47 256.01 204.45 2014m05 164.46 258.52 207.84 2014m06 166.70 261.55 210.70 2014m07 166.05 267.92 217.90 2014m08 167.01 272.94 223.31 2014m09 172.58 278.27 228.18 2014m10 165.25 282.65 232.73 2014m11 182.75 286.42 234.00 2014m12 177.27 290.80 238.35 2015m01 187.61 297.39 245.02 2015m02 182.45 304.60 248.73 2015m03 184.23 304.60 250.00 2015m04 185.58 310.76 253.50 2015m05 196.78 312.23 255.72 2015m06 192.81 314.84 259.96 2015m07 196.21 317.76 261.55 2015m08 199.67 319.02 263.45 2015m09 189.30 319.85 260.91 2015m10 197.14 315.88 255.40 2015m11 198.37 306.58 247.14 2015m12 199.60 297.81 240.25 2016m01 173.39 291.54 236.55 2016m02 179.25 286.00 230.19 2016m03 167.01 283.59 229.98 2016m04 159.85 285.58 230.93 2016m05 176.28 288.19 233.37 2016m06 169.46 288.82 235.28 2016m07 171.54 294.36 239.30 2016m08 174.17 300.31 246.40 2016m09 187.43 309.51 252.97 2016m10 195.26 317.97 260.28 2016m11 189.47 320.48 263.56 2016m12 194.74 321.21 264.94 2017m01 201.03 323.62 266.00 2017m02 195.65 328.11 269.17 2017m03 191.24 335.63 275.21 2017m04 200.62 344.83 284.53 2017m05 202.71 348.59 287.39 2017m06 197.33 351.20 291.95 2017m07 196.03 352.66 291.95 2017m08 214.50 354.96 292.58 2017m09 197.59 356.11 292.80 2017m10 220.89 359.67 295.23 2017m11 218.48 362.80 298.41 2017m12 216.55 368.55 303.39 2018m01 220.69 374.50 306.99 2018m02 229.43 380.88 313.35 2018m03 226.64 386.62 318.43 2018m04 236.33 393.94 325.00 2018m05 250.90 400.63 333.69 2018m06 240.20 408.67 340.04 2018m07 240.52 412.54 343.64 *Reference from RVD Selected Popular Development is taken from all classes + suburban area data