
Property Price Trend of Miami Beach Towers
The Price Index reflects the property price at a specific time. In general, the value of Miami Beach Tower has increased since the year 1991. However, several periods should be highlighted as the property price experienced a slightly drastic change due to a number of incidents.
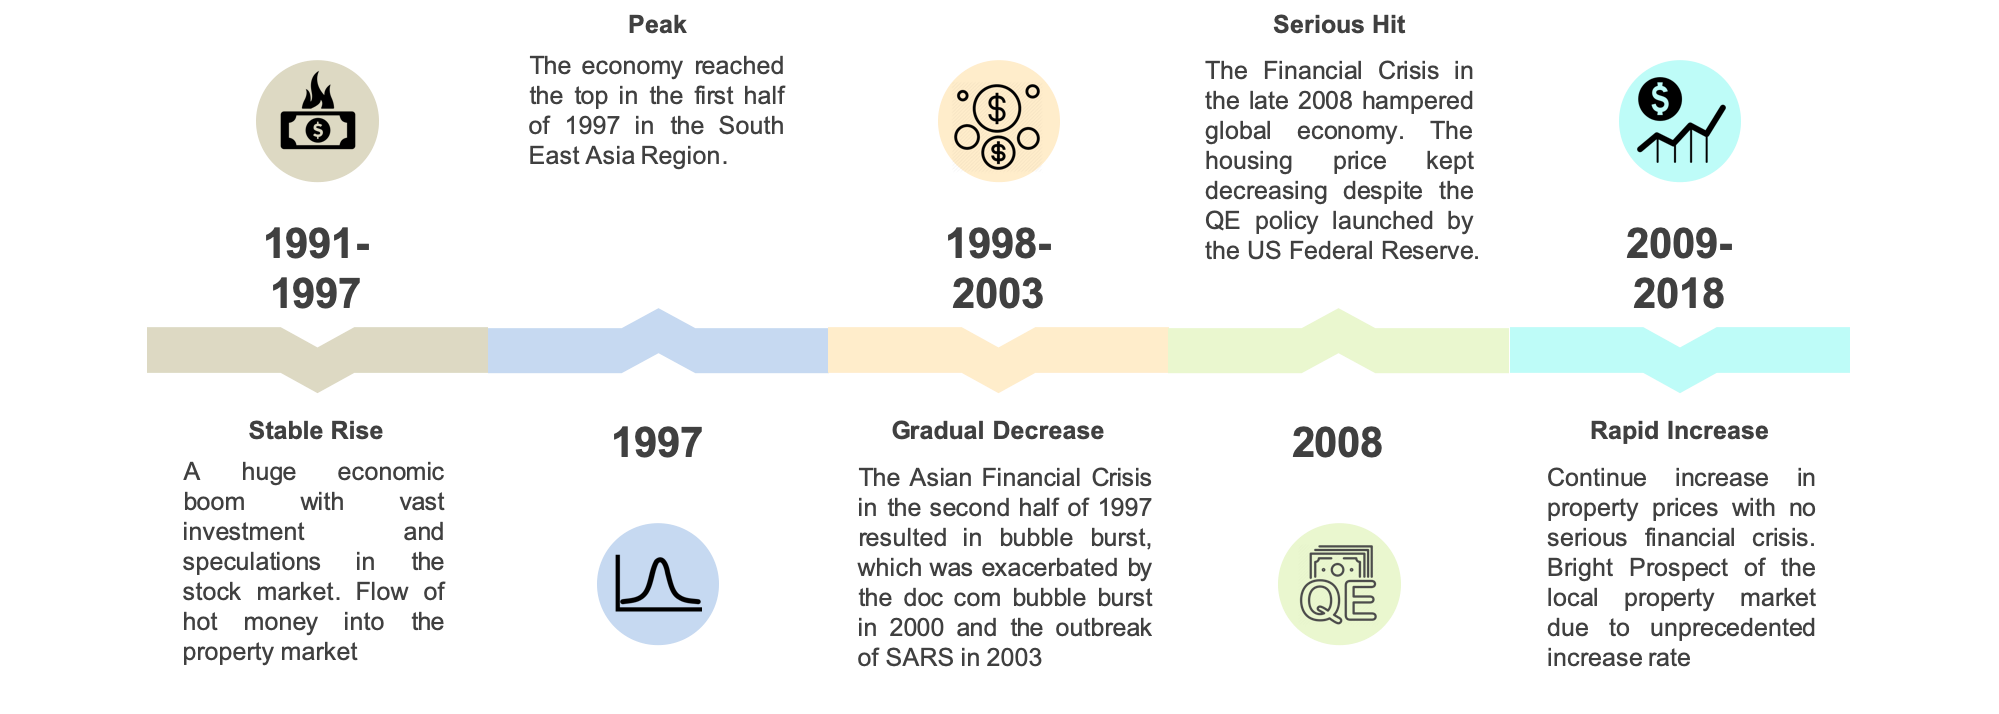
Stable rise from 1991 to 1997
In the early 90s, countries in Southeast Asia experienced a huge economic boom. Investors and speculators were eager to put money in the stock market. Also, as the currency in the region stayed strong, hot money flowed into the property market, which boosted the value of the property. Despite the increase in the Hong Kong prime rate happened in 1995, the property price increased gradually from 1991 to 1997.
Peak at 1997 and drop from 1998 to 2003
The economy in the Southeast Asia region came to the top in the first half of 1997. Starting from July the same year, the Asian Financial Crisis occurred. The bubble started to burst which caused huge damage to the economy in Hong Kong. In addition to the doc com bubble burst in 2000 and the outbreak of SARS in 2003, it reduced people’s confidence towards the property market, hence the Price Index dropped gradually from 1998 to 2003.
A serious hit at 2008
After SARS in 2003, the Hong Kong property market began to regain investor’s confidence. The property price from 2003 to 2008 increased slowly but stably. However, the financial crisis that happened in late 2008 imposed a detrimental effect on the global economy. The bankruptcy of Lehman Brothers deterred people’s willingness to make investments. Although the US Federal Reserve launched quantitative easing in November 2008, the housing price still decreased significantly.
The rapid increase in the recent 10 years
As there were no serious financial crises happened again in the recent 10 years, the property price has risen continuously. Yet, the unprecedented increase rate experienced in this decade attributes to the bright prospect of the property market in Hong Kong. One of the reasons why investors were so optimistic about the property price came to the closer connection between Hong Kong and mainland China.
In Conclusion, what affects the Price Index of Miami Beach Tower?
In retrospect, as the world has become more and more globalised, the trend of the property price of Miami Beach Tower is affected by the global economy. The outbreak of the financial crisis or economic boom in Hong Kong and the rest of the world affects the Price Index. Therefore, the trend of the Price Index is driven by both local and foreign factors.
The detail of the Price Index can be found below (Price Index in 1991m04 is assumed to be 100).
| Month | Price Index |
|---|---|
| 1991m04 | 100 |
| 1991m05 | 92.02 |
| 1991m06 | 91.40 |
| 1991m07 | 113.50 |
| 1991m08 | 131.03 |
| 1991m09 | 140.86 |
| 1991m10 | 149.39 |
| 1991m11 | 153.30 |
| 1991m12 | 145.73 |
| 1992m01 | 148.73 |
| 1992m02 | 153.67 |
| 1992m03 | 154.30 |
| 1992m04 | 165.37 |
| 1992m05 | 163.01 |
| 1992m06 | 164.16 |
| 1992m07 | 169.85 |
| 1992m08 | 169.81 |
| 1992m09 | 161.69 |
| 1992m10 | 173.42 |
| 1992m11 | 166.12 |
| 1992m12 | 158.89 |
| 1993m01 | 158.41 |
| 1993m02 | 157.22 |
| 1993m03 | 156.51 |
| 1993m04 | 159.83 |
| 1993m05 | 159.81 |
| 1993m06 | 166.21 |
| 1993m07 | 169.84 |
| 1993m08 | 170.80 |
| 1993m09 | 170.07 |
| 1993m10 | 173.59 |
| 1993m11 | 168.41 |
| 1993m12 | 165.61 |
| 1994m01 | 173.23 |
| 1994m02 | 179.12 |
| 1994m03 | 183.70 |
| 1994m04 | 197.06 |
| 1994m05 | 202.59 |
| 1994m06 | 207.63 |
| 1994m07 | 194.23 |
| 1994m08 | 195.14 |
| 1994m09 | 194.11 |
| 1994m10 | 196.33 |
| 1994m11 | 205.32 |
| 1994m12 | 191.09 |
| 1995m01 | 194.07 |
| 1995m02 | 182.95 |
| 1995m03 | 190.38 |
| 1995m04 | 188.51 |
| 1995m05 | 187.90 |
| 1995m06 | 187.65 |
| 1995m07 | 187.10 |
| 1995m08 | 183.56 |
| 1995m09 | 181.79 |
| 1995m10 | 177.93 |
| 1995m11 | 170.89 |
| 1995m12 | 169.10 |
| 1996m01 | 175.50 |
| 1996m02 | 180.12 |
| 1996m03 | 186.26 |
| 1996m04 | 184.79 |
| 1996m05 | 190.91 |
| 1996m06 | 192.62 |
| 1996m07 | 197.15 |
| 1996m08 | 201.67 |
| 1996m09 | 209.62 |
| 1996m10 | 214.14 |
| 1996m11 | 231.35 |
| 1996m12 | 245.05 |
| 1997m01 | 264.23 |
| 1997m02 | 291.81 |
| 1997m03 | 322.96 |
| 1997m04 | 337.19 |
| 1997m05 | 345.02 |
| 1997m06 | 369.57 |
| 1997m07 | 372.50 |
| 1997m08 | 348.35 |
| 1997m09 | 352.92 |
| 1997m10 | 359.93 |
| 1997m11 | 305.80 |
| 1997m12 | 311.02 |
| 1998m01 | 267.13 |
| 1998m02 | 213.76 |
| 1998m03 | 250.13 |
| 1998m04 | 232.87 |
| 1998m05 | 243.34 |
| 1998m06 | 200.17 |
| 1998m07 | 181.87 |
| 1998m08 | 190.64 |
| 1998m09 | 173.45 |
| 1998m10 | 164.97 |
| 1998m11 | 178.43 |
| 1998m12 | 187.80 |
| 1999m01 | 190.55 |
| 1999m02 | 176.88 |
| 1999m03 | 175.28 |
| 1999m04 | 177.50 |
| 1999m05 | 182.35 |
| 1999m06 | 180.72 |
| 1999m07 | 178.33 |
| 1999m08 | 170.17 |
| 1999m09 | 170.26 |
| 1999m10 | 157.09 |
| 1999m11 | 159.15 |
| 1999m12 | 154.62 |
| 2000m01 | 153.64 |
| 2000m02 | 165.92 |
| 2000m03 | 156.38 |
| 2000m04 | 156.84 |
| 2000m05 | 150.11 |
| 2000m06 | 146.52 |
| 2000m07 | 141.37 |
| 2000m08 | 131.52 |
| 2000m09 | 138.08 |
| 2000m10 | 152.11 |
| 2000m11 | 149.20 |
| 2000m12 | 142.02 |
| 2001m01 | 129.67 |
| 2001m02 | 121.74 |
| 2001m03 | 126.35 |
| 2001m04 | 123.28 |
| 2001m05 | 124.81 |
| 2001m06 | 126.60 |
| 2001m07 | 134.35 |
| 2001m08 | 126.73 |
| 2001m09 | 123.35 |
| 2001m10 | 120.05 |
| 2001m11 | 112.85 |
| 2001m12 | 118.25 |
| 2002m01 | 117.43 |
| 2002m02 | 116.55 |
| 2002m03 | 119.76 |
| 2002m04 | 123.58 |
| 2002m05 | 120.23 |
| 2002m06 | 118.66 |
| 2002m07 | 122.56 |
| 2002m08 | 115.98 |
| 2002m09 | 113.64 |
| 2002m10 | 108.84 |
| 2002m11 | 105.34 |
| 2002m12 | 104.11 |
| 2003m01 | 104.50 |
| 2003m02 | |
| 2003m03 | 105.70 |
| 2003m04 | 90.11 |
| 2003m05 | 99.33 |
| 2003m06 | 100.82 |
| 2003m07 | 102.42 |
| 2003m08 | 98.52 |
| 2003m09 | 94.81 |
| 2003m10 | 101.52 |
| 2003m11 | 87.65 |
| 2003m12 | 105.70 |
| 2004m01 | 102.98 |
| 2004m02 | 117.96 |
| 2004m03 | 121.11 |
| 2004m04 | 118.09 |
| 2004m05 | 124.25 |
| 2004m06 | 123.12 |
| 2004m07 | 116.72 |
| 2004m08 | 115.37 |
| 2004m09 | 130.23 |
| 2004m10 | 122.48 |
| 2004m11 | 129.44 |
| 2004m12 | 123.94 |
| 2005m01 | 141.54 |
| 2005m02 | 145.00 |
| 2005m03 | 138.81 |
| 2005m04 | 137.39 |
| 2005m05 | 144.93 |
| 2005m06 | 144.93 |
| 2005m07 | 138.89 |
| 2005m08 | 138.63 |
| 2005m09 | 152.51 |
| 2005m10 | 145.62 |
| 2005m11 | 148.35 |
| 2005m12 | 150.71 |
| 2006m01 | 131.70 |
| 2006m02 | 142.57 |
| 2006m03 | 145.12 |
| 2006m04 | 125.62 |
| 2006m05 | 136.07 |
| 2006m06 | 134.50 |
| 2006m07 | 134.41 |
| 2006m08 | 136.36 |
| 2006m09 | 124.44 |
| 2006m10 | 132.33 |
| 2006m11 | 132.68 |
| 2006m12 | 128.33 |
| 2007m01 | 130.31 |
| 2007m02 | 121.64 |
| 2007m03 | 124.76 |
| 2007m04 | 126.05 |
| 2007m05 | 127.97 |
| 2007m06 | 130.57 |
| 2007m07 | 138.38 |
| 2007m08 | 137.48 |
| 2007m09 | 147.29 |
| 2007m10 | 143.63 |
| 2007m11 | 140.32 |
| 2007m12 | 145.89 |
| 2008m01 | 155.58 |
| 2008m02 | 160.66 |
| 2008m03 | 166.15 |
| 2008m04 | 157.39 |
| 2008m05 | 168.46 |
| 2008m06 | 169.47 |
| 2008m07 | 166.80 |
| 2008m08 | 153.26 |
| 2008m09 | 160.40 |
| 2008m10 | 166.45 |
| 2008m11 | 126.23 |
| 2008m12 | 127.51 |
| 2009m01 | 138.81 |
| 2009m02 | 136.86 |
| 2009m03 | 143.54 |
| 2009m04 | 146.42 |
| 2009m05 | 159.20 |
| 2009m06 | 157.27 |
| 2009m07 | 153.88 |
| 2009m08 | 169.42 |
| 2009m09 | 173.54 |
| 2009m10 | 178.79 |
| 2009m11 | 173.16 |
| 2009m12 | 167.98 |
| 2010m01 | 179.99 |
| 2010m02 | 184.19 |
| 2010m03 | 189.19 |
| 2010m04 | 189.10 |
| 2010m05 | 193.93 |
| 2010m06 | 193.43 |
| 2010m07 | 204.78 |
| 2010m08 | 208.85 |
| 2010m09 | 214.49 |
| 2010m10 | 210.52 |
| 2010m11 | 222.70 |
| 2010m12 | 217.36 |
| 2011m01 | 227.27 |
| 2011m02 | 230.02 |
| 2011m03 | 235.80 |
| 2011m04 | 247.90 |
| 2011m05 | 243.72 |
| 2011m06 | 253.20 |
| 2011m07 | 242.70 |
| 2011m08 | 249.99 |
| 2011m09 | 246.07 |
| 2011m10 | |
| 2011m11 | 238.64 |
| 2011m12 | 249.87 |
| 2012m01 | 232.99 |
| 2012m02 | 254.50 |
| 2012m03 | 251.83 |
| 2012m04 | 267.48 |
| 2012m05 | 270.99 |
| 2012m06 | 288.33 |
| 2012m07 | 268.23 |
| 2012m08 | 290.10 |
| 2012m09 | 302.55 |
| 2012m10 | 316.68 |
| 2012m11 | 324.03 |
| 2012m12 | 329.42 |
| 2013m01 | 327.10 |
| 2013m02 | 342.34 |
| 2013m03 | 324.10 |
| 2013m04 | 332.70 |
| 2013m05 | 329.86 |
| 2013m06 | 347.37 |
| 2013m07 | 332.87 |
| 2013m08 | 332.87 |
| 2013m09 | 345.94 |
| 2013m10 | 340.25 |
| 2013m11 | 347.46 |
| 2013m12 | 335.66 |
| 2014m01 | 337.90 |
| 2014m02 | 281.61 |
| 2014m03 | 368.67 |
| 2014m04 | 338.60 |
| 2014m05 | 358.97 |
| 2014m06 | 358.14 |
| 2014m07 | 361.96 |
| 2014m08 | 366.86 |
| 2014m09 | 372.21 |
| 2014m10 | 404.30 |
| 2014m11 | 393.95 |
| 2014m12 | 409.88 |
| 2015m01 | 450.64 |
| 2015m02 | 455.78 |
| 2015m03 | 416.34 |
| 2015m04 | 462.17 |
| 2015m05 | 450.70 |
| 2015m06 | 465.88 |
| 2015m07 | 483.18 |
| 2015m08 | 461.30 |
| 2015m09 | |
| 2015m10 | 437.82 |
| 2015m11 | 440.11 |
| 2015m12 | 439.17 |
| 2016m01 | 422.91 |
| 2016m02 | 423.61 |
| 2016m03 | 405.13 |
| 2016m04 | 396.40 |
| 2016m05 | 408.80 |
| 2016m06 | 442.32 |
| 2016m07 | 429.82 |
| 2016m08 | 453.05 |
| 2016m09 | 440.54 |
| 2016m10 | 463.09 |
| 2016m11 | 491.66 |
| 2016m12 | 487.70 |
| 2017m01 | 480.83 |
| 2017m02 | 480.94 |
| 2017m03 | 485.96 |
| 2017m04 | 497.12 |
| 2017m05 | 543.87 |
| 2017m06 | 583.10 |
| 2017m07 | |
| 2017m08 | 489.19 |
| 2017m09 | 574.66 |
| 2017m10 | 526.49 |
| 2017m11 | 574.73 |
| 2017m12 | 549.53 |
| 2018m01 | 598.90 |
| 2018m02 | 620.67 |
| 2018m03 | 605.20 |
| 2018m04 | 646.03 |
| 2018m05 | 594.15 |
| 2018m06 | 608.50 |
| 2018m07 | 689.25 |