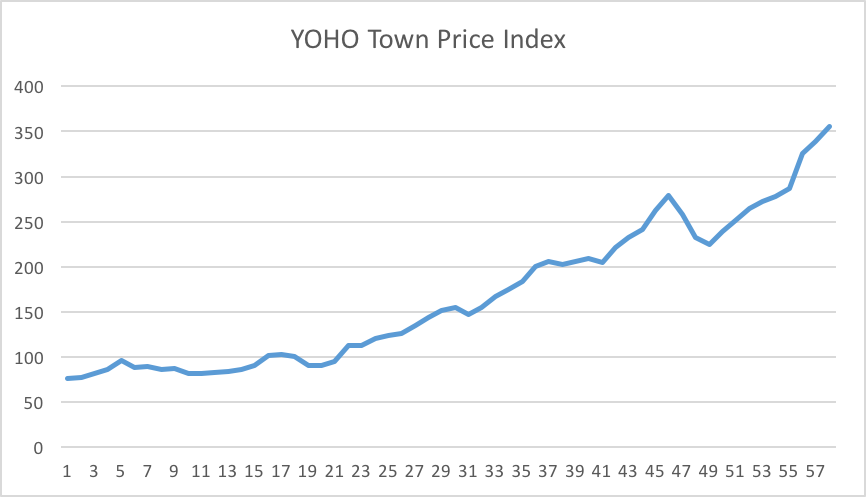
The price index of YOHO Town is constructed on a quarterly basis, setting 2004 quarter 2 as a base period with index 100. It provides an overview of the property price of the residential property from 2004 quarter 2 to 2018 quarter 3 which is the most recent month transaction is recorded.
The index is calculated using the average of unit prices of that quarter with reference to the base period unit price, with the following results.
According to the diagram, the property price of YOHO Town increases from quarter 1 (2004 quarter 1) to quarter 47 (2015 quarter 3). Then a drop is witnessed from from 306.4 in quarter 47 (2015 quarter 3) to 275.6 in quarter 49 (2016 quarter 1). After the drop, the property price kept increasing. Overall, the price index of YOHO Town has been on an increasing trend over the 14 years. The most recent index is 356.1 in 2018 quarter 3.
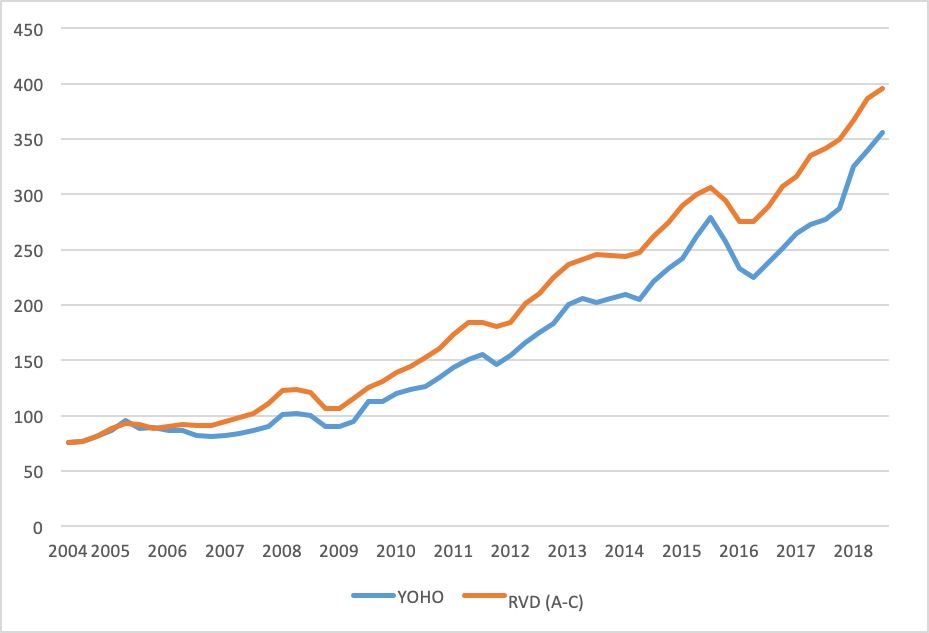
RVD’s price index of Class A to Class C is used to compare with the price index of YOHO Town.
When comparing the Price Index of YOHO Town with the RVD price index, it can be observed that the trend of price index of YOHO Town is similar to the general price trend in Hong Kong.