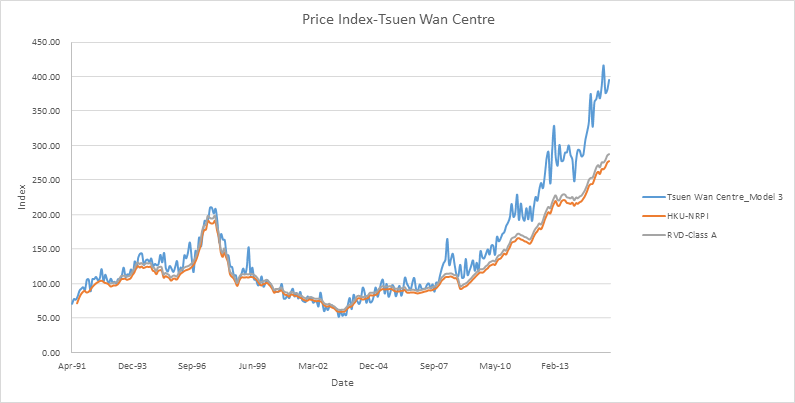
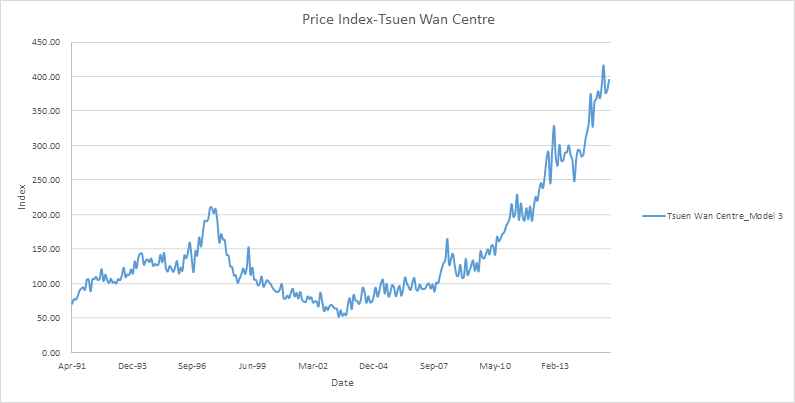
Generally, the Price Index of Tsuen Wan Centre have increased from around 70 units to nearly 400 units. The price index increased gradually from around 70 units to around 200 units in 1997. A peak of about 200 units was reached in 1997. After that, it fell gradually from around 200 units in 1997 to nearly 50 units in 2003. In 2003, there was a trough in price index, which was also the lowest point from 1991 to 2015. Starting from 2003, it has started to rise gradually and jumped in 2008. From then, it has rose steeply and reached a plateau in 2012. Then, it has increased steeply and reached another plateau in 2013. After that, there was a dramatic increase in price index in 2014, arriving at nearly 400 units.
As a whole, the Price Index of Tsuen Wan Centre has demonstrated a similar trend with the HKU-NRPI and the price index of Class A flats according to RVD. The gradual increase from 1991 to 1996 was nearly the same. They all reached a peak at 1997 and then decreased to a trough in 2003. They all increased gradually from 2003 to 2008. However, the gradient of increase of HKU-NRPI and RVD-Class A were less steeply than that of Price Index of Tsuen Wan Centre. The HKU-NRPI and RVD-Class A arrived at around 275 units at the end, while at the same time, the Price Index of Tsuen Wan Centre reached nearly 400 units.