
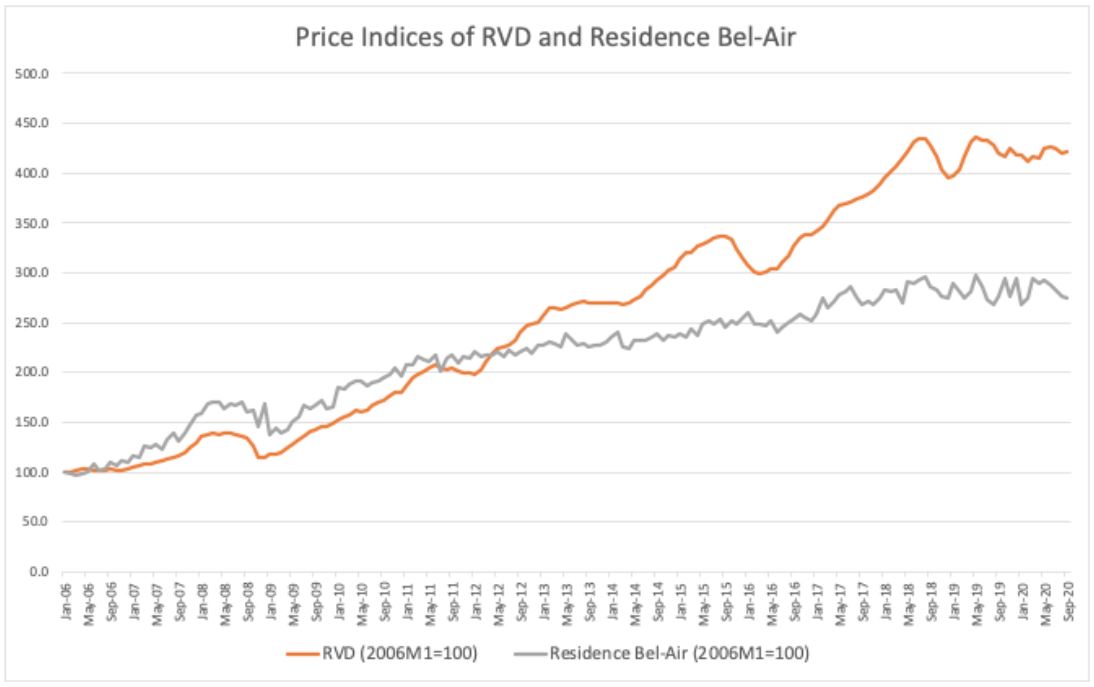
Residence Bel-Air performs substandardly compared with the market since 2011 From the graph, it is clear that the price index of Residence Bel-Air underperformed the whole Hong Kong market since 2011, the growth of the Residence Bel-Air’s price index is obviously smaller than that of the Hong Kong housing market. One of the reasons that can explain the phenomenon is that the increase in the price of smaller units is larger than that of the overall prices of housing units.
According to the RVD’s data of price indices of private domestic , the increase of price indices of Class A Housing (Site floor area less than 40 square metre) is higher than that of other classes. Price Index of Class A has increased by 127% from 2011 to 2019 while the overall price index of the private domestic market has increased by 110% only from 2011 to 2019. As a result, it means that a large portion of the growth of the overall housing price index is driven by the soaring increase of the price index of Class A units.
Nevertheless, as Residence Bel-Air does not provide any small units like Class A, the increase of price index of Bel-Air units is smaller than that for the overall housing market, especially of the Class A units. It means that the increase in demand for smaller units is higher than the increase in demand for larger units like the Bel-Air units, mainly due to the fact that small units are more favourable for the investors and buyers.
| Residence Bel-Air Index | RVD Index | |
| 01/2006 | 100.0 | 100.0 |
| 02/2006 | 99.2 | 100.3 |
| 03/2006 | 96.4 | 102.0 |
| 04/2006 | 98.5 | 102.9 |
| 05/2006 | 100.4 | 103.5 |
| 06/2006 | 107.8 | 101.7 |
| 07/2006 | 102.1 | 101.2 |
| 08/2006 | 103.9 | 102.4 |
| 09/2006 | 109.5 | 102.8 |
| 10/2006 | 106.0 | 102.5 |
| 11/2006 | 111.4 | 102.4 |
| 12/2006 | 109.3 | 103.3 |
| 01/2007 | 116.6 | 104.8 |
| 02/2007 | 115.2 | 106.4 |
| 03/2007 | 125.7 | 107.8 |
| 04/2007 | 124.0 | 108.7 |
| 05/2007 | 128.0 | 110.7 |
| 06/2007 | 122.8 | 111.9 |
| 07/2007 | 133.1 | 113.2 |
| 08/2007 | 138.8 | 114.5 |
| 09/2007 | 131.1 | 116.0 |
| 10/2007 | 138.9 | 119.5 |
| 11/2007 | 147.7 | 124.8 |
| 12/2007 | 157.9 | 129.8 |
| 01/2008 | 159.1 | 135.7 |
| 02/2008 | 169.1 | 138.2 |
| 03/2008 | 169.9 | 139.2 |
| 04/2008 | 170.9 | 137.3 |
| 05/2008 | 164.5 | 139.2 |
| 06/2008 | 169.3 | 139.4 |
| 07/2008 | 167.4 | 137.6 |
| 08/2008 | 170.0 | 135.4 |
| 09/2008 | 159.8 | 134.3 |
| 10/2008 | 162.1 | 125.9 |
| 11/2008 | 145.8 | 115.5 |
| 12/2008 | 169.4 | 115.4 |
| 01/2009 | 137.9 | 118.0 |
| 02/2009 | 144.1 | 118.7 |
| 03/2009 | 138.7 | 120.3 |
| 04/2009 | 143.3 | 124.9 |
| 05/2009 | 150.7 | 128.5 |
| 06/2009 | 155.0 | 133.4 |
| 07/2009 | 166.5 | 136.7 |
| 08/2009 | 164.2 | 140.3 |
| 09/2009 | 167.8 | 143.1 |
| 10/2009 | 171.8 | 145.0 |
| 11/2009 | 164.2 | 145.7 |
| 12/2009 | 164.9 | 148.3 |
| 01/2010 | 185.0 | 152.3 |
| 02/2010 | 183.2 | 155.0 |
| 03/2010 | 188.2 | 157.9 |
| 04/2010 | 191.2 | 161.5 |
| 05/2010 | 192.3 | 160.6 |
| 06/2010 | 186.4 | 161.8 |
| 07/2010 | 189.4 | 166.6 |
| 08/2010 | 190.7 | 170.6 |
| 09/2010 | 194.9 | 171.9 |
| 10/2010 | 197.4 | 176.4 |
| 11/2010 | 204.4 | 180.3 |
| 12/2010 | 195.8 | 179.5 |
| 01/2011 | 208.6 | 186.7 |
| 02/2011 | 207.5 | 194.3 |
| 03/2011 | 215.9 | 197.7 |
| 04/2011 | 212.5 | 201.9 |
| 05/2011 | 211.5 | 204.7 |
| 06/2011 | 217.4 | 207.2 |
| 07/2011 | 201.5 | 204.3 |
| 08/2011 | 214.4 | 203.2 |
| 09/2011 | 217.6 | 204.4 |
| 10/2011 | 209.3 | 201.8 |
| 11/2011 | 215.9 | 200.4 |
| 12/2011 | 213.9 | 199.4 |
| 01/2012 | 220.5 | 198.0 |
| 02/2012 | 215.3 | 202.4 |
| 03/2012 | 217.6 | 211.7 |
| 04/2012 | 216.8 | 218.6 |
| 05/2012 | 220.5 | 223.8 |
| 06/2012 | 215.9 | 225.9 |
| 07/2012 | 223.3 | 227.0 |
| 08/2012 | 218.2 | 232.2 |
| 09/2012 | 220.8 | 239.9 |
| 10/2012 | 224.5 | 246.4 |
| 11/2012 | 219.4 | 248.8 |
| 12/2012 | 227.9 | 250.7 |
| 01/2013 | 227.7 | 256.1 |
| 02/2013 | 230.0 | 264.3 |
| 03/2013 | 228.8 | 264.2 |
| 04/2013 | 225.6 | 263.7 |
| 05/2013 | 238.9 | 265.2 |
| 06/2013 | 232.2 | 268.0 |
| 07/2013 | 227.7 | 269.9 |
| 08/2013 | 229.6 | 271.3 |
| 09/2013 | 225.4 | 270.4 |
| 10/2013 | 227.0 | 270.3 |
| 11/2013 | 227.6 | 269.8 |
| 12/2013 | 230.3 | 269.9 |
| 01/2014 | 235.1 | 269.5 |
| 02/2014 | 239.9 | 269.1 |
| 03/2014 | 226.2 | 268.4 |
| 04/2014 | 224.6 | 269.8 |
| 05/2014 | 233.0 | 272.5 |
| 06/2014 | 232.5 | 275.7 |
| 07/2014 | 232.7 | 282.4 |
| 08/2014 | 235.4 | 287.7 |
| 09/2014 | 238.1 | 293.3 |
| 10/2014 | 232.4 | 297.9 |
| 11/2014 | 237.0 | 301.9 |
| 12/2014 | 235.9 | 306.5 |
| 01/2015 | 239.6 | 313.4 |
| 02/2015 | 236.3 | 321.0 |
| 03/2015 | 243.0 | 321.0 |
| 04/2015 | 236.7 | 327.5 |
| 05/2015 | 248.8 | 329.1 |
| 06/2015 | 251.5 | 331.8 |
| 07/2015 | 248.6 | 334.9 |
| 08/2015 | 253.9 | 336.2 |
| 09/2015 | 244.8 | 337.1 |
| 10/2015 | 252.0 | 332.9 |
| 11/2015 | 248.8 | 323.1 |
| 12/2015 | 254.7 | 313.9 |
| 01/2016 | 259.4 | 307.3 |
| 02/2016 | 249.0 | 301.4 |
| 03/2016 | 249.1 | 298.9 |
| 04/2016 | 246.4 | 301.0 |
| 05/2016 | 251.6 | 303.7 |
| 06/2016 | 240.2 | 304.4 |
| 07/2016 | 246.1 | 310.2 |
| 08/2016 | 250.1 | 316.5 |
| 09/2016 | 253.4 | 326.2 |
| 10/2016 | 258.9 | 335.1 |
| 11/2016 | 254.7 | 337.8 |
| 12/2016 | 252.4 | 338.5 |
| 01/2017 | 259.0 | 341.1 |
| 02/2017 | 274.2 | 345.8 |
| 03/2017 | 265.6 | 353.7 |
| 04/2017 | 270.9 | 363.4 |
| 05/2017 | 277.2 | 367.4 |
| 06/2017 | 280.9 | 370.2 |
| 07/2017 | 285.8 | 371.7 |
| 08/2017 | 274.2 | 374.1 |
| 09/2017 | 268.7 | 375.3 |
| 10/2017 | 271.2 | 379.1 |
| 11/2017 | 268.1 | 382.4 |
| 12/2017 | 275.4 | 388.4 |
| 01/2018 | 282.8 | 394.7 |
| 02/2018 | 281.8 | 401.4 |
| 03/2018 | 282.8 | 407.5 |
| 04/2018 | 269.7 | 415.2 |
| 05/2018 | 291.4 | 422.2 |
| 06/2018 | 289.7 | 430.7 |
| 07/2018 | 292.6 | 434.8 |
| 08/2018 | 295.6 | 434.6 |
| 09/2018 | 285.7 | 428.9 |
| 10/2018 | 282.6 | 417.1 |
| 11/2018 | 275.7 | 404.0 |
| 12/2018 | 273.9 | 395.8 |
| 01/2019 | 288.8 | 397.6 |
| 02/2019 | 281.6 | 404.2 |
| 03/2019 | 274.1 | 417.1 |
| 04/2019 | 280.7 | 432.0 |
| 05/2019 | 298.2 | 437.1 |
| 06/2019 | 285.4 | 433.6 |
| 07/2019 | 272.6 | 433.4 |
| 08/2019 | 268.2 | 427.5 |
| 09/2019 | 277.1 | 420.0 |
| 10/2019 | 294.1 | 416.5 |
| 11/2019 | 277.1 | 424.3 |
| 12/2019 | 294.6 | 417.6 |
| 01/2020 | 268.4 | 418.2 |
| 02/2020 | 274.2 | 411.2 |
| 03/2020 | 294.3 | 416.7 |
| 04/2020 | 290.1 | 415.7 |
| 05/2020 | 292.2 | 425.2 |
| 06/2020 | 287.8 | 425.9 |
| 07/2020 | 282.7 | 424.2 |
| 08/2020 | 276.8 | 419.6 |
| 09/2020 | 274.9 | 421.4 |